Air Quality Measured in New Districts of Tatabánya
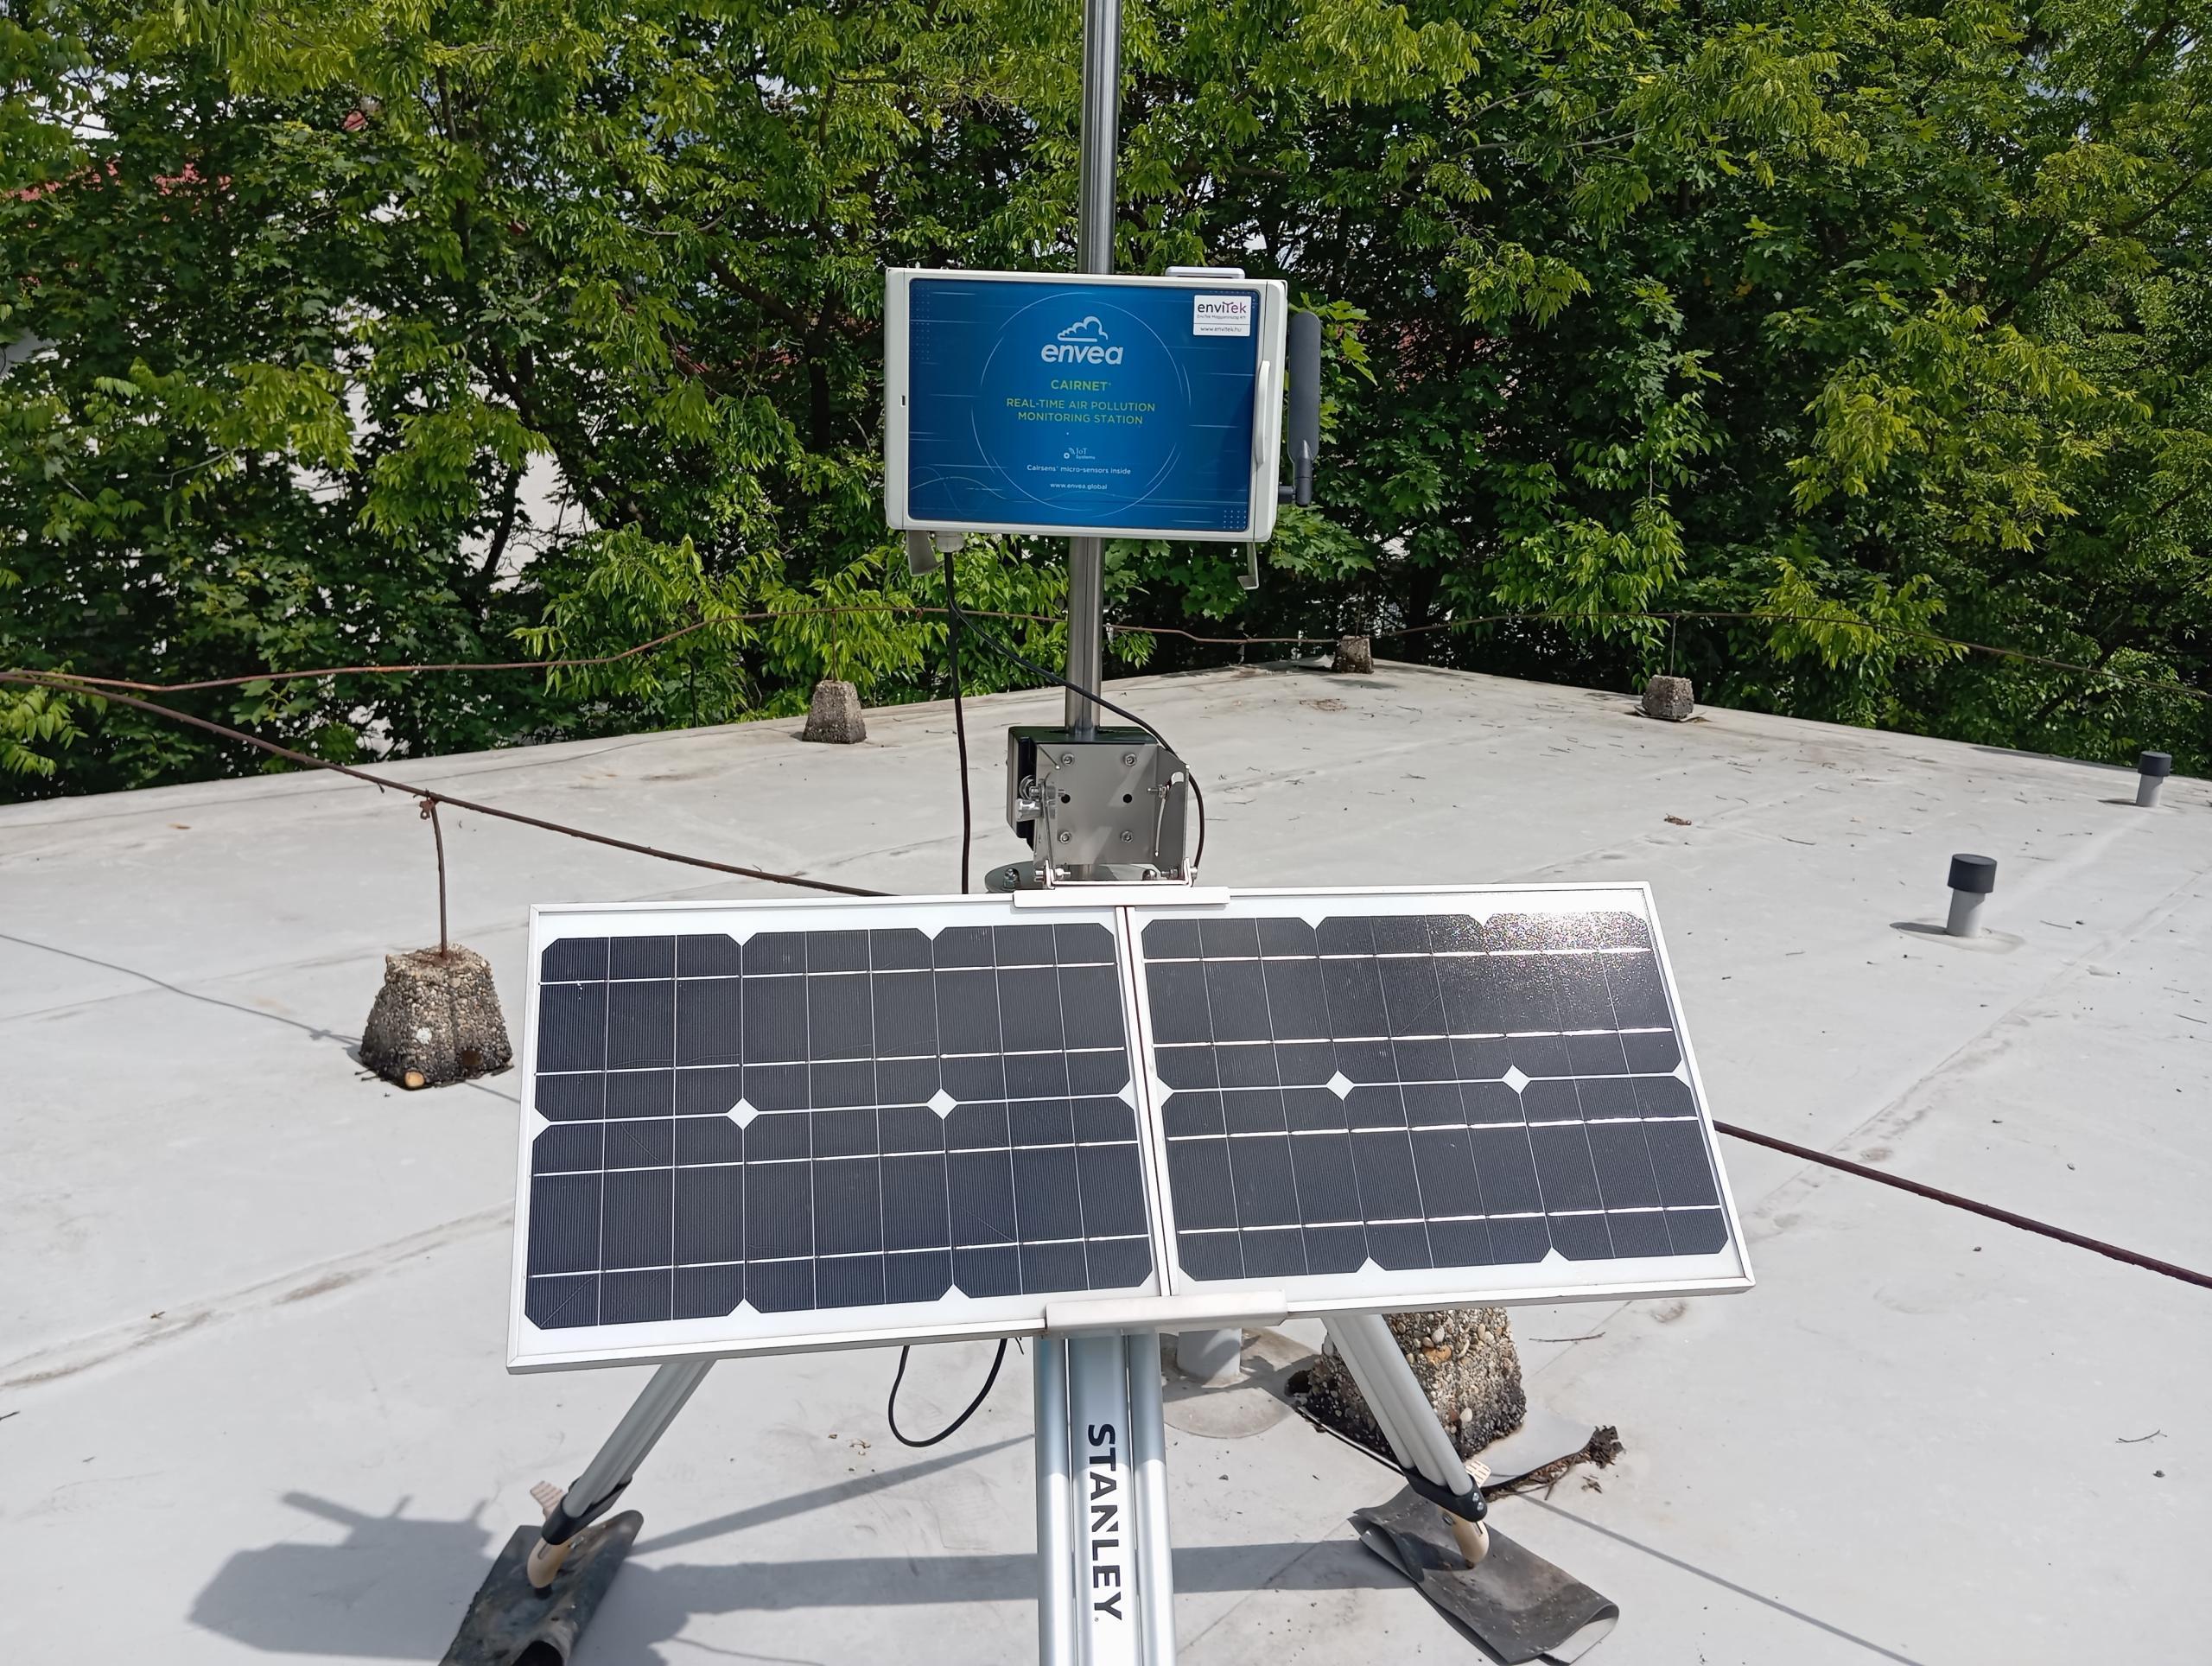
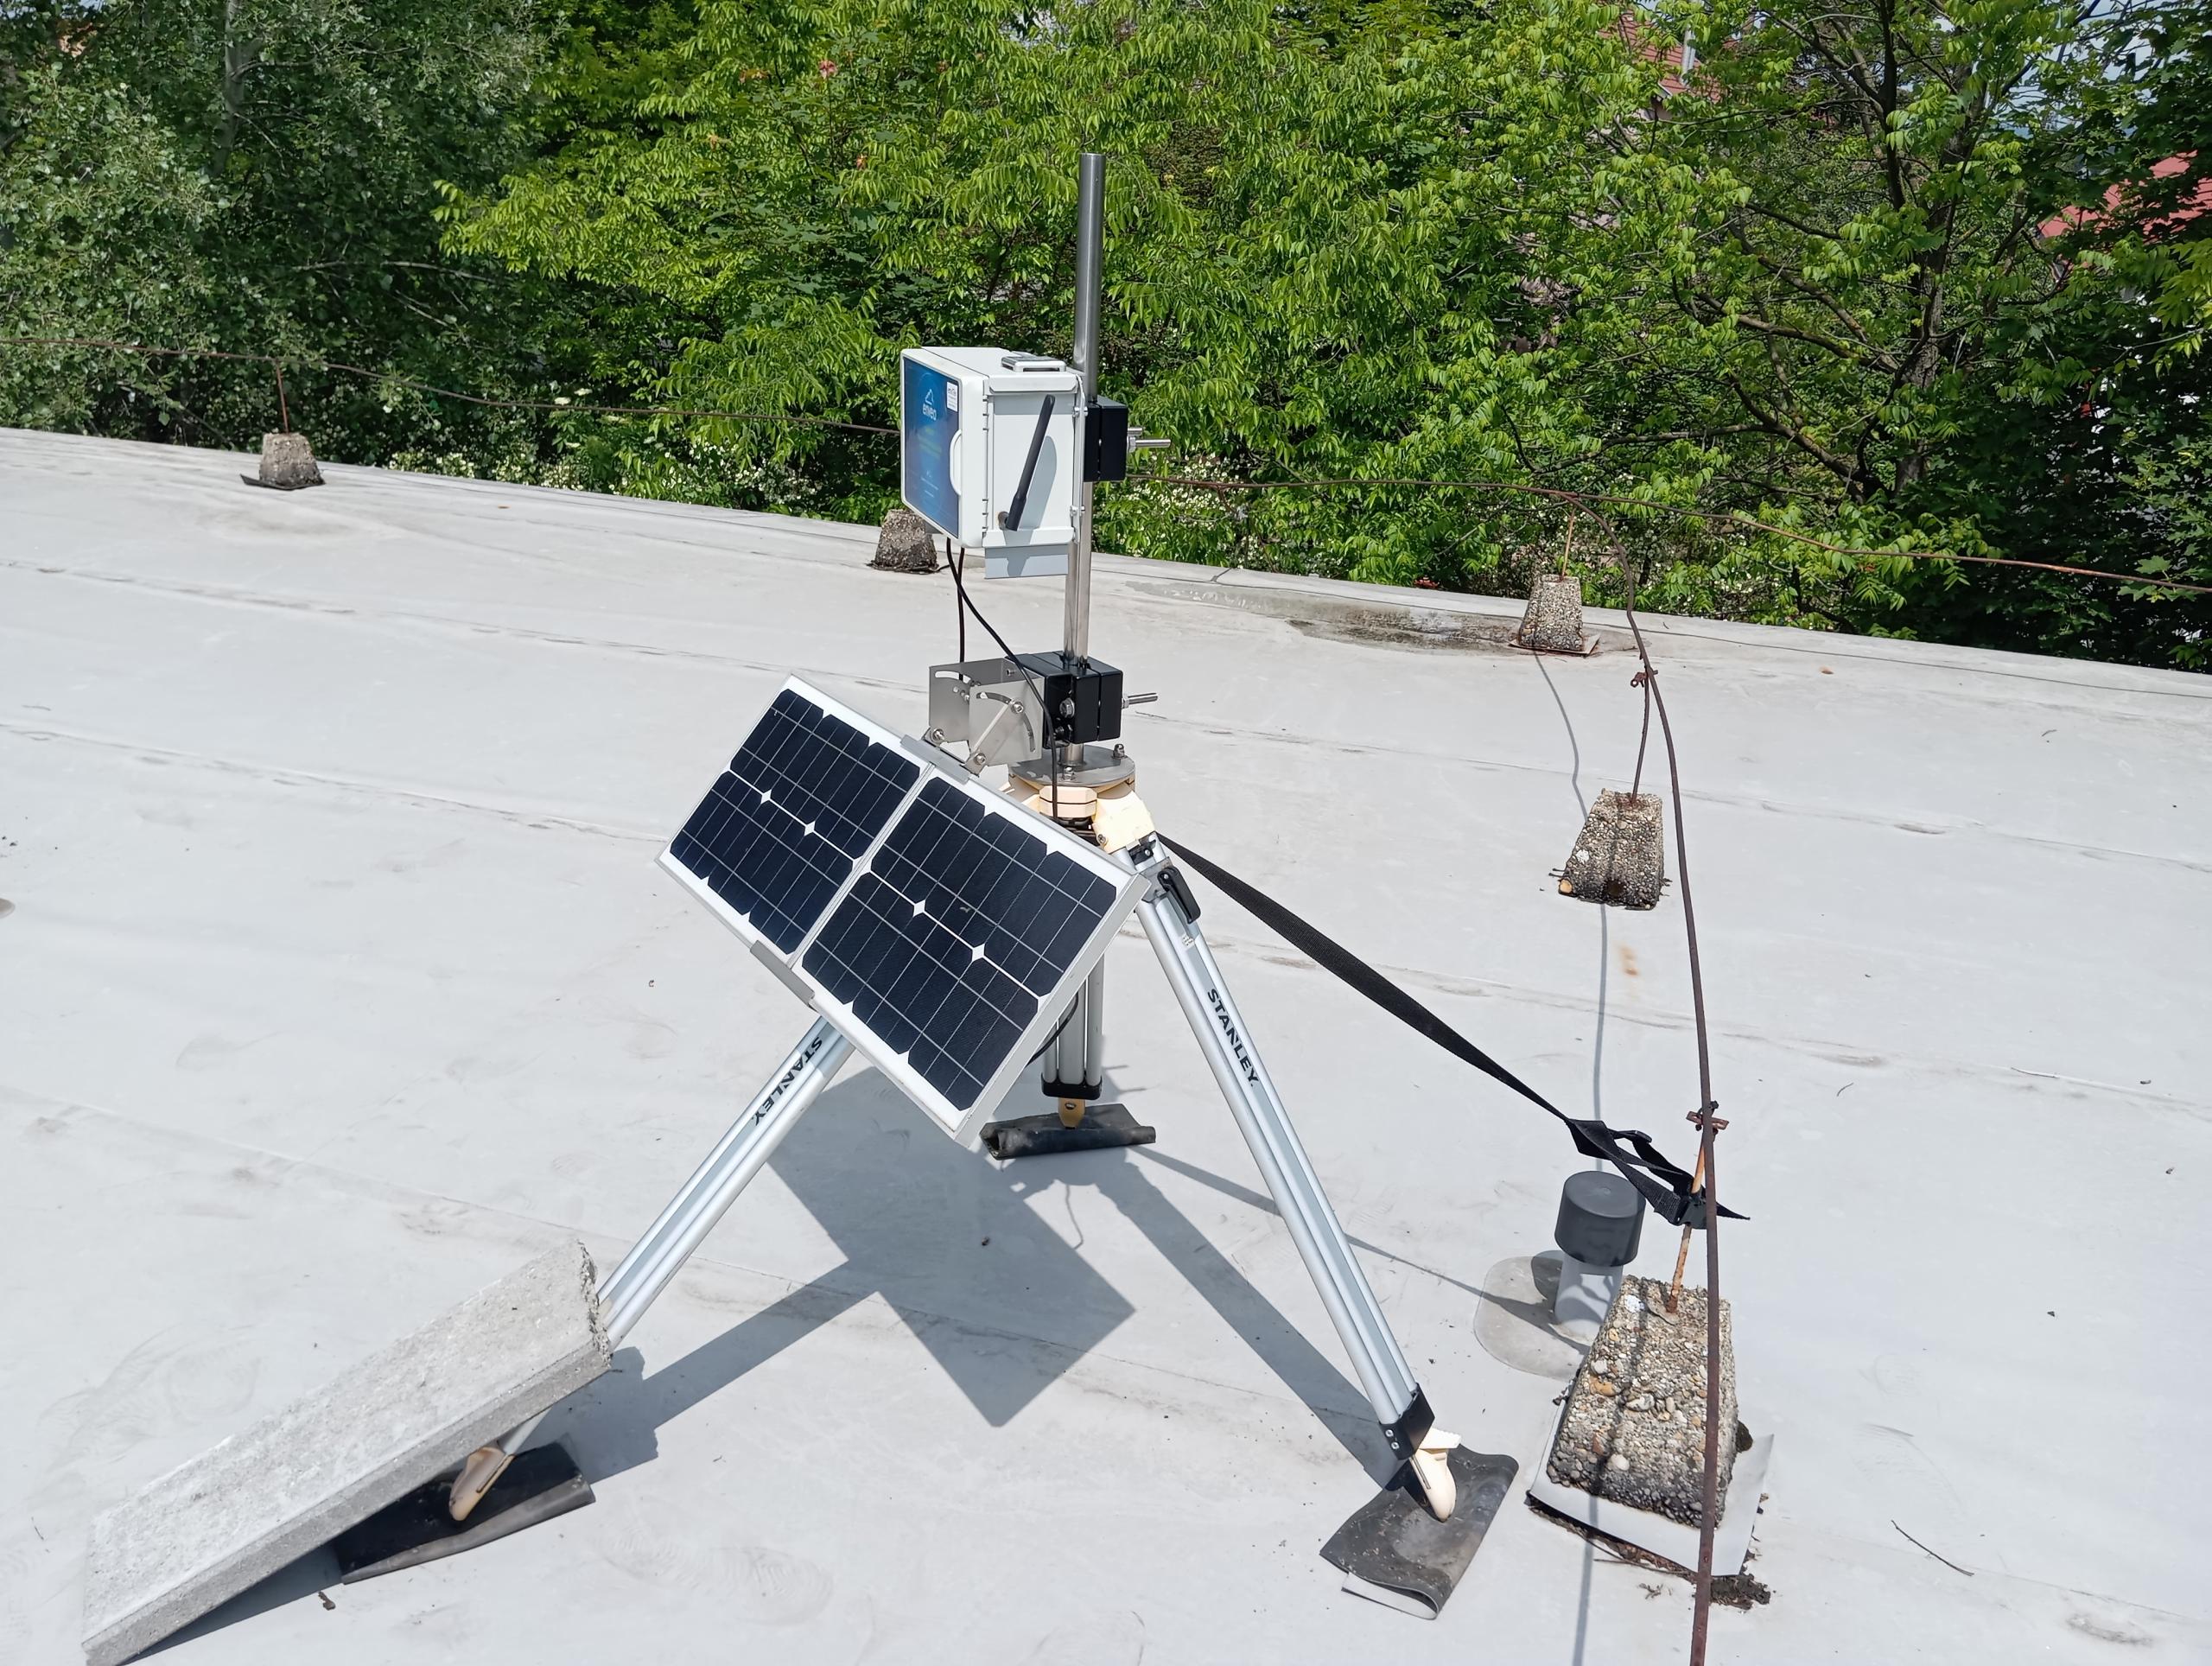
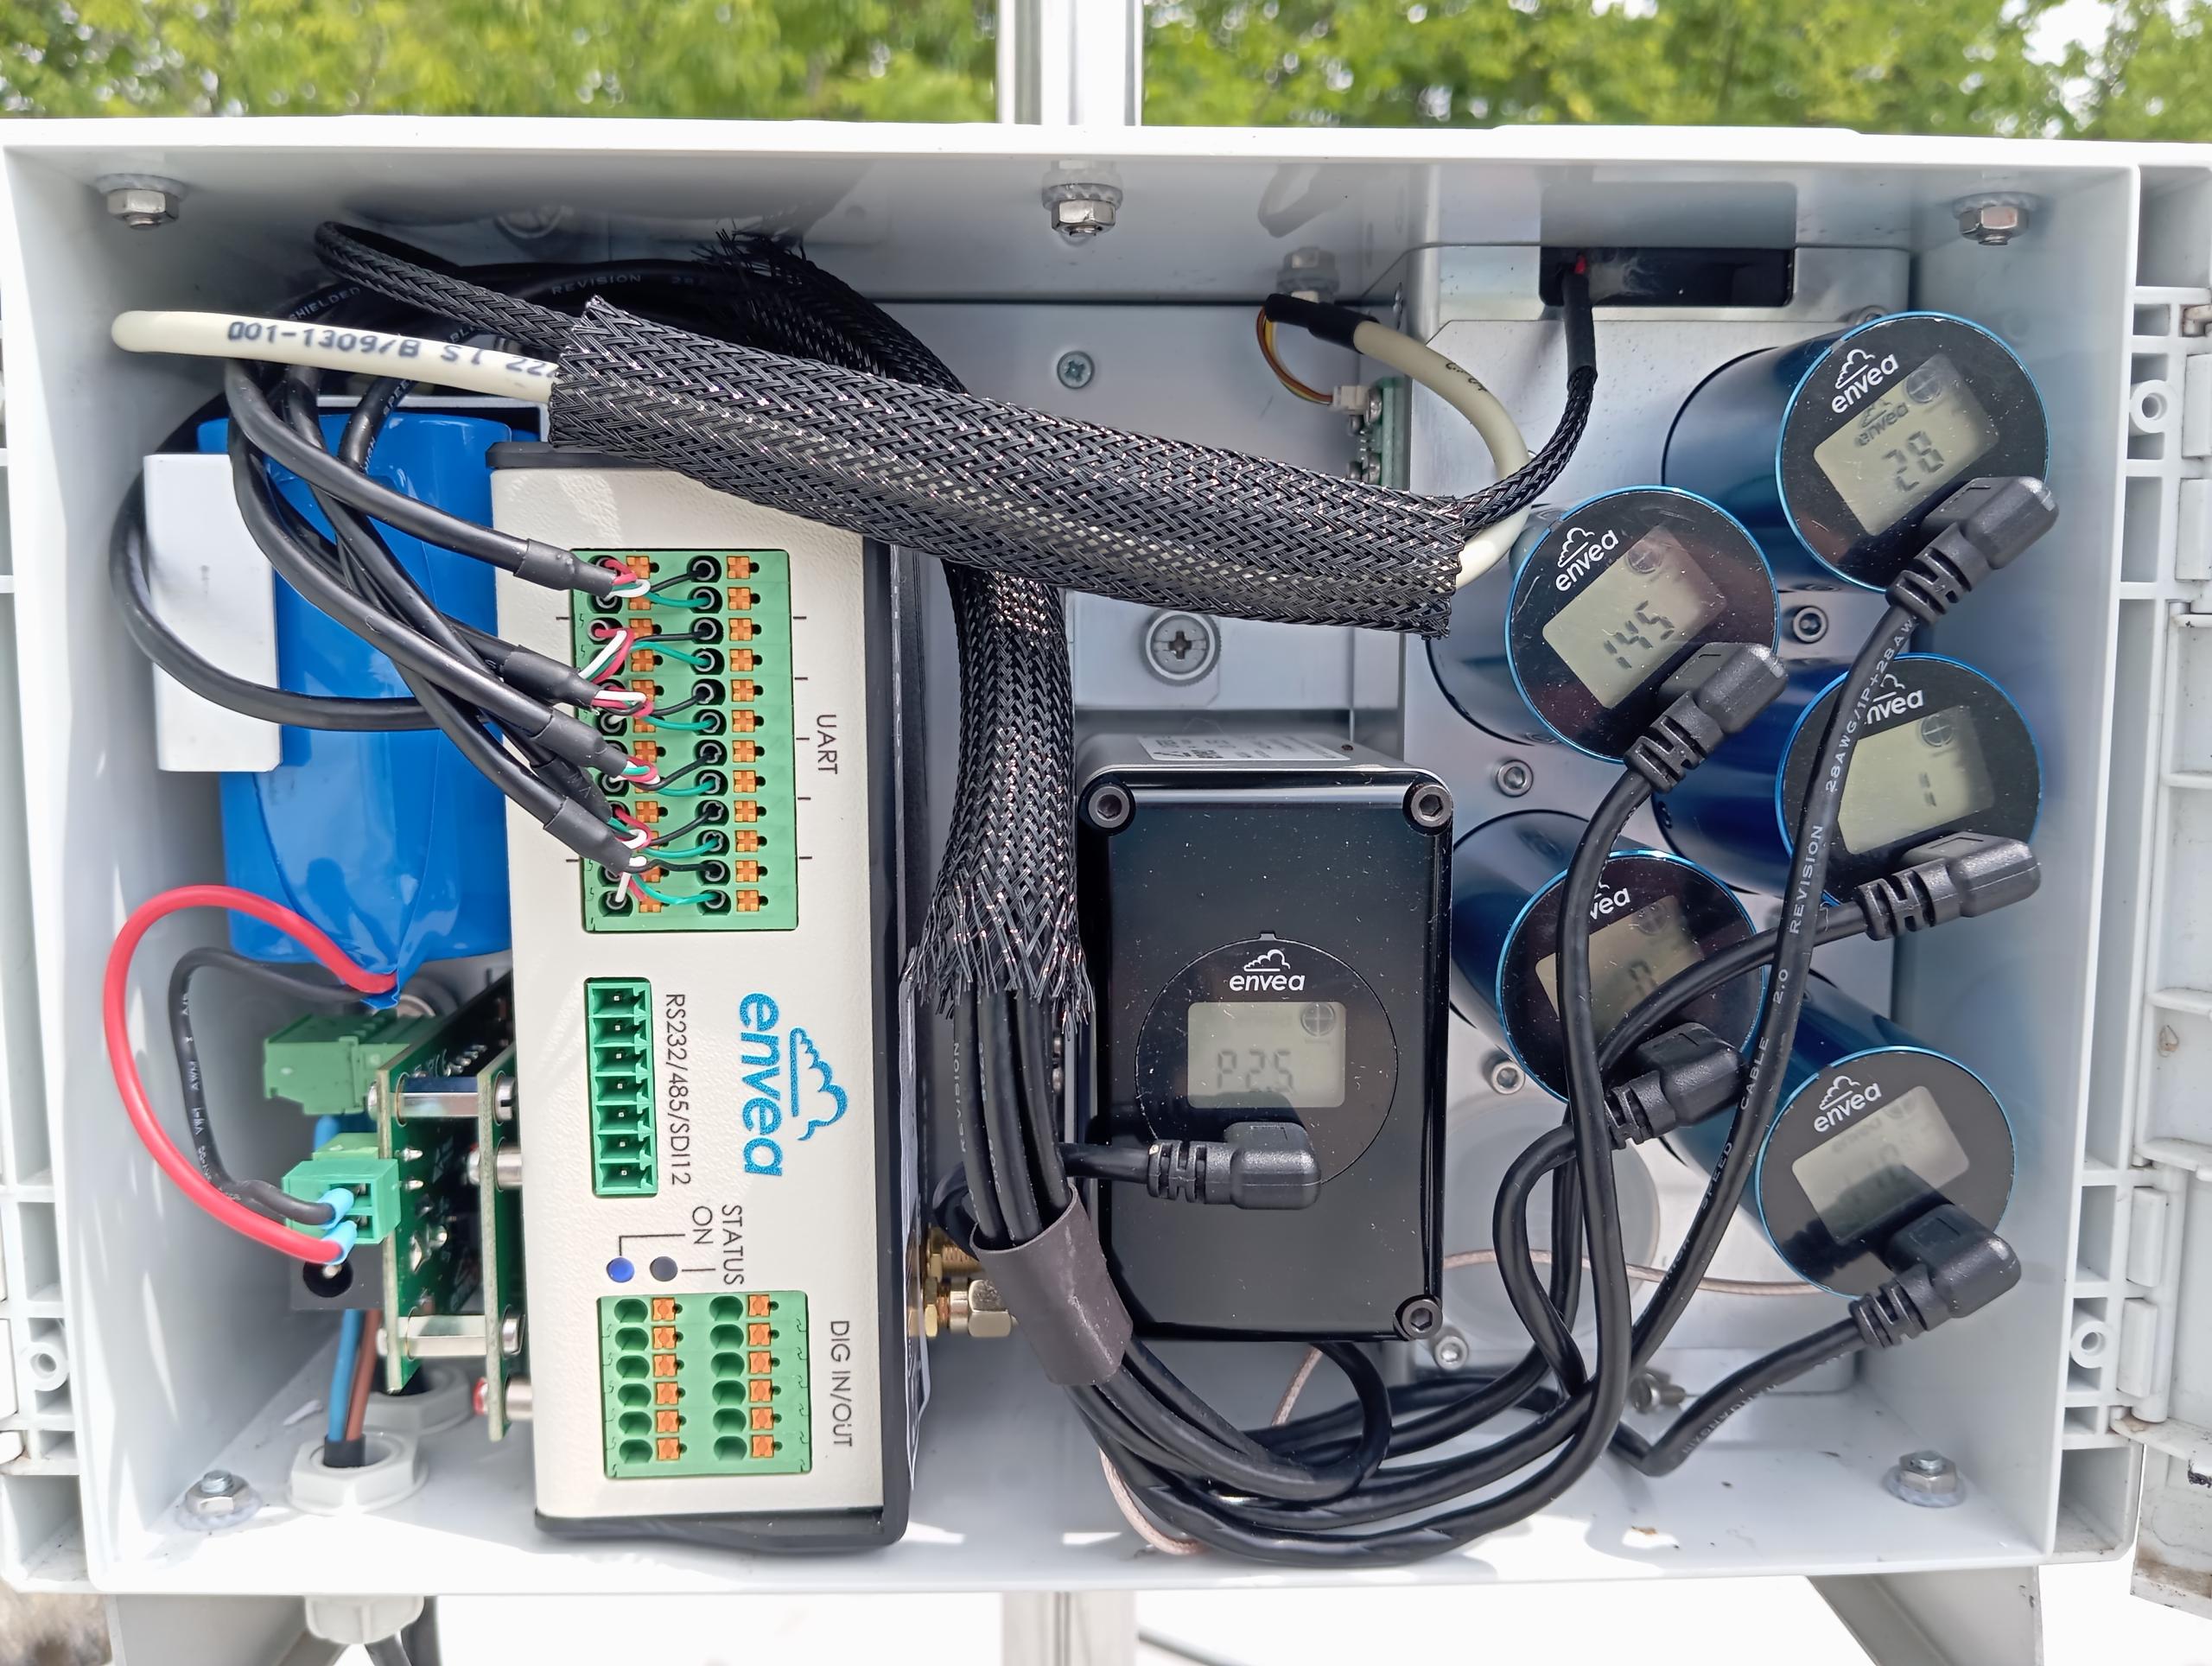
As part of the LIFE Integrated Project titled "Improving air quality in 8 regions by facilitating the implementation of air quality plans," Tatabánya City Municipality purchased three Envea Cairnet® mobile microsensor measurement stations, enabling the monitoring of the city’s air quality. The aim of the equipment is to provide the municipality with more accurate information on air pollution levels and to identify areas of the city that require new air quality improvement measures based on the measurements.
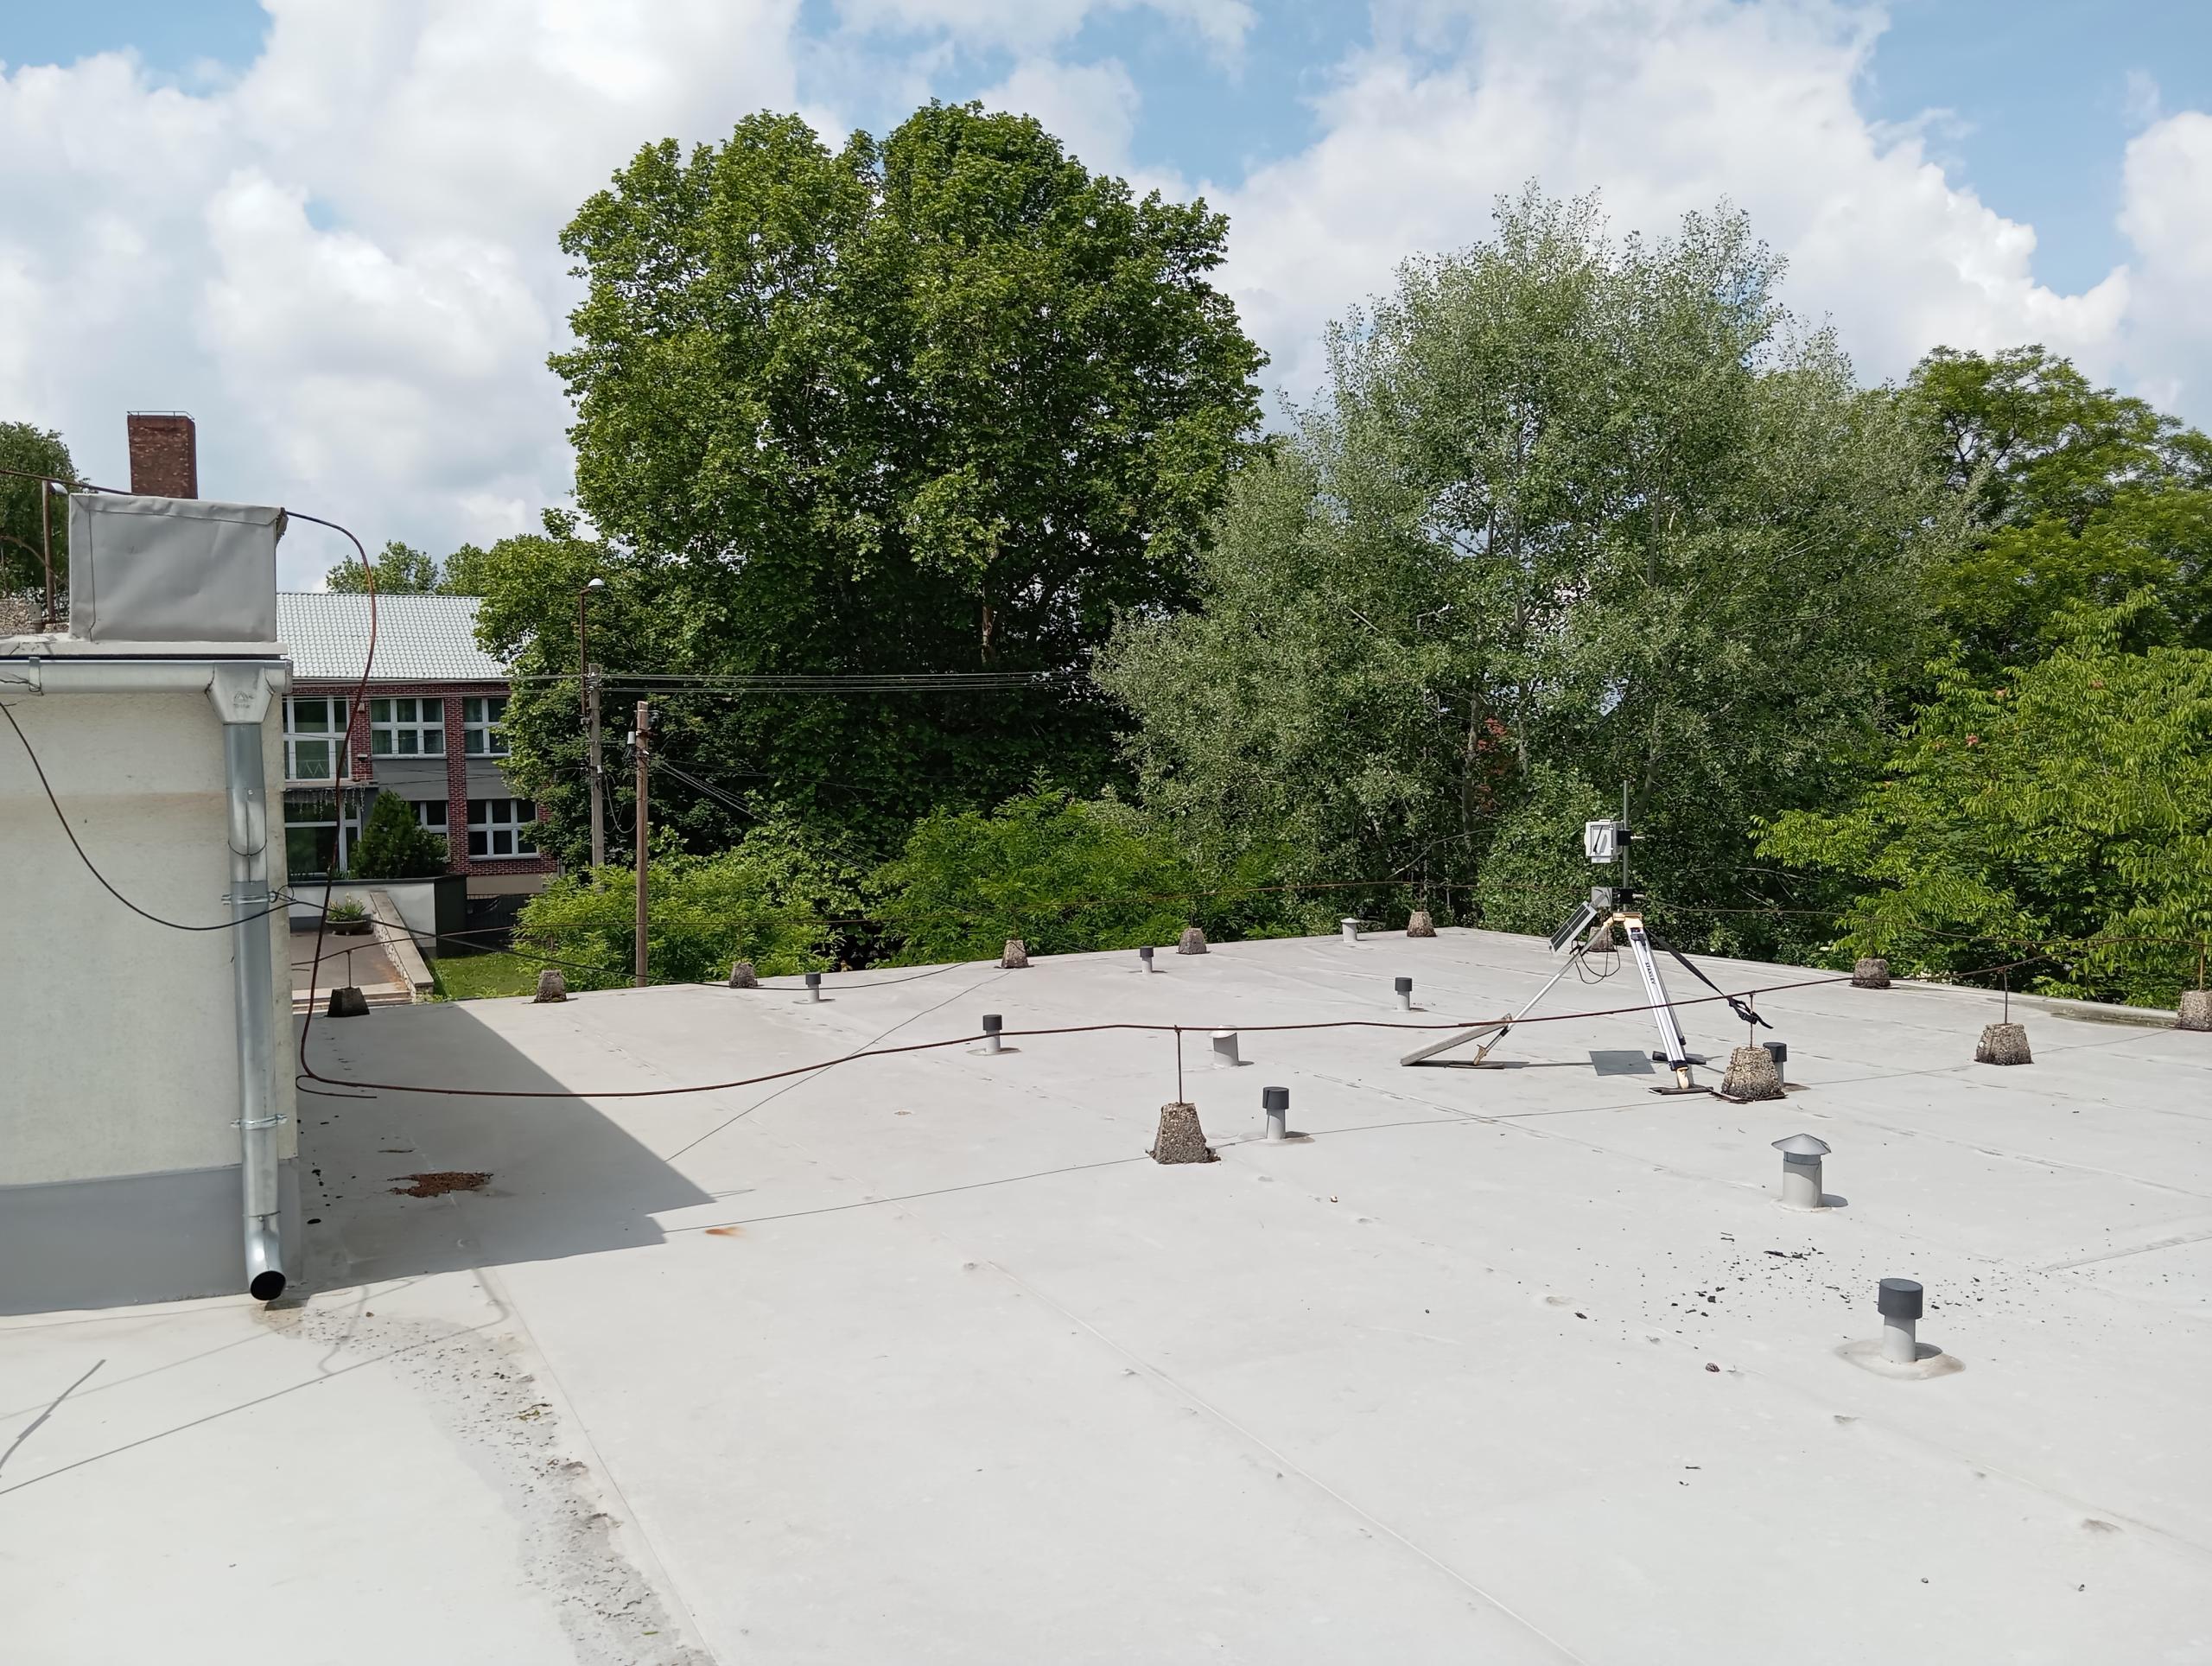
In the past one and a half years, the sensors were installed in the Felsőgalla district, on the flat-roofed buildings of Széchenyi István Primary School, Péch Antal Technical Secondary School, and ESZI Szent Márton Center.
There were similarities between the readings from the automatic measurement station on Szent Borbála Street and the mobile devices; however, there were significant differences in the concentrations of sulfur dioxide and fine aerosol particles (commonly known as “particulate matter” or “dust”). Between January and March 2024, there were seven open-pit explosions in the nearby quarry in the Felsőgalla area. The highest particulate matter concentrations occurred between January 30 and February 8, 2024. The differences in the measurements were likely caused by local heating practices and the open-pit mining activities.
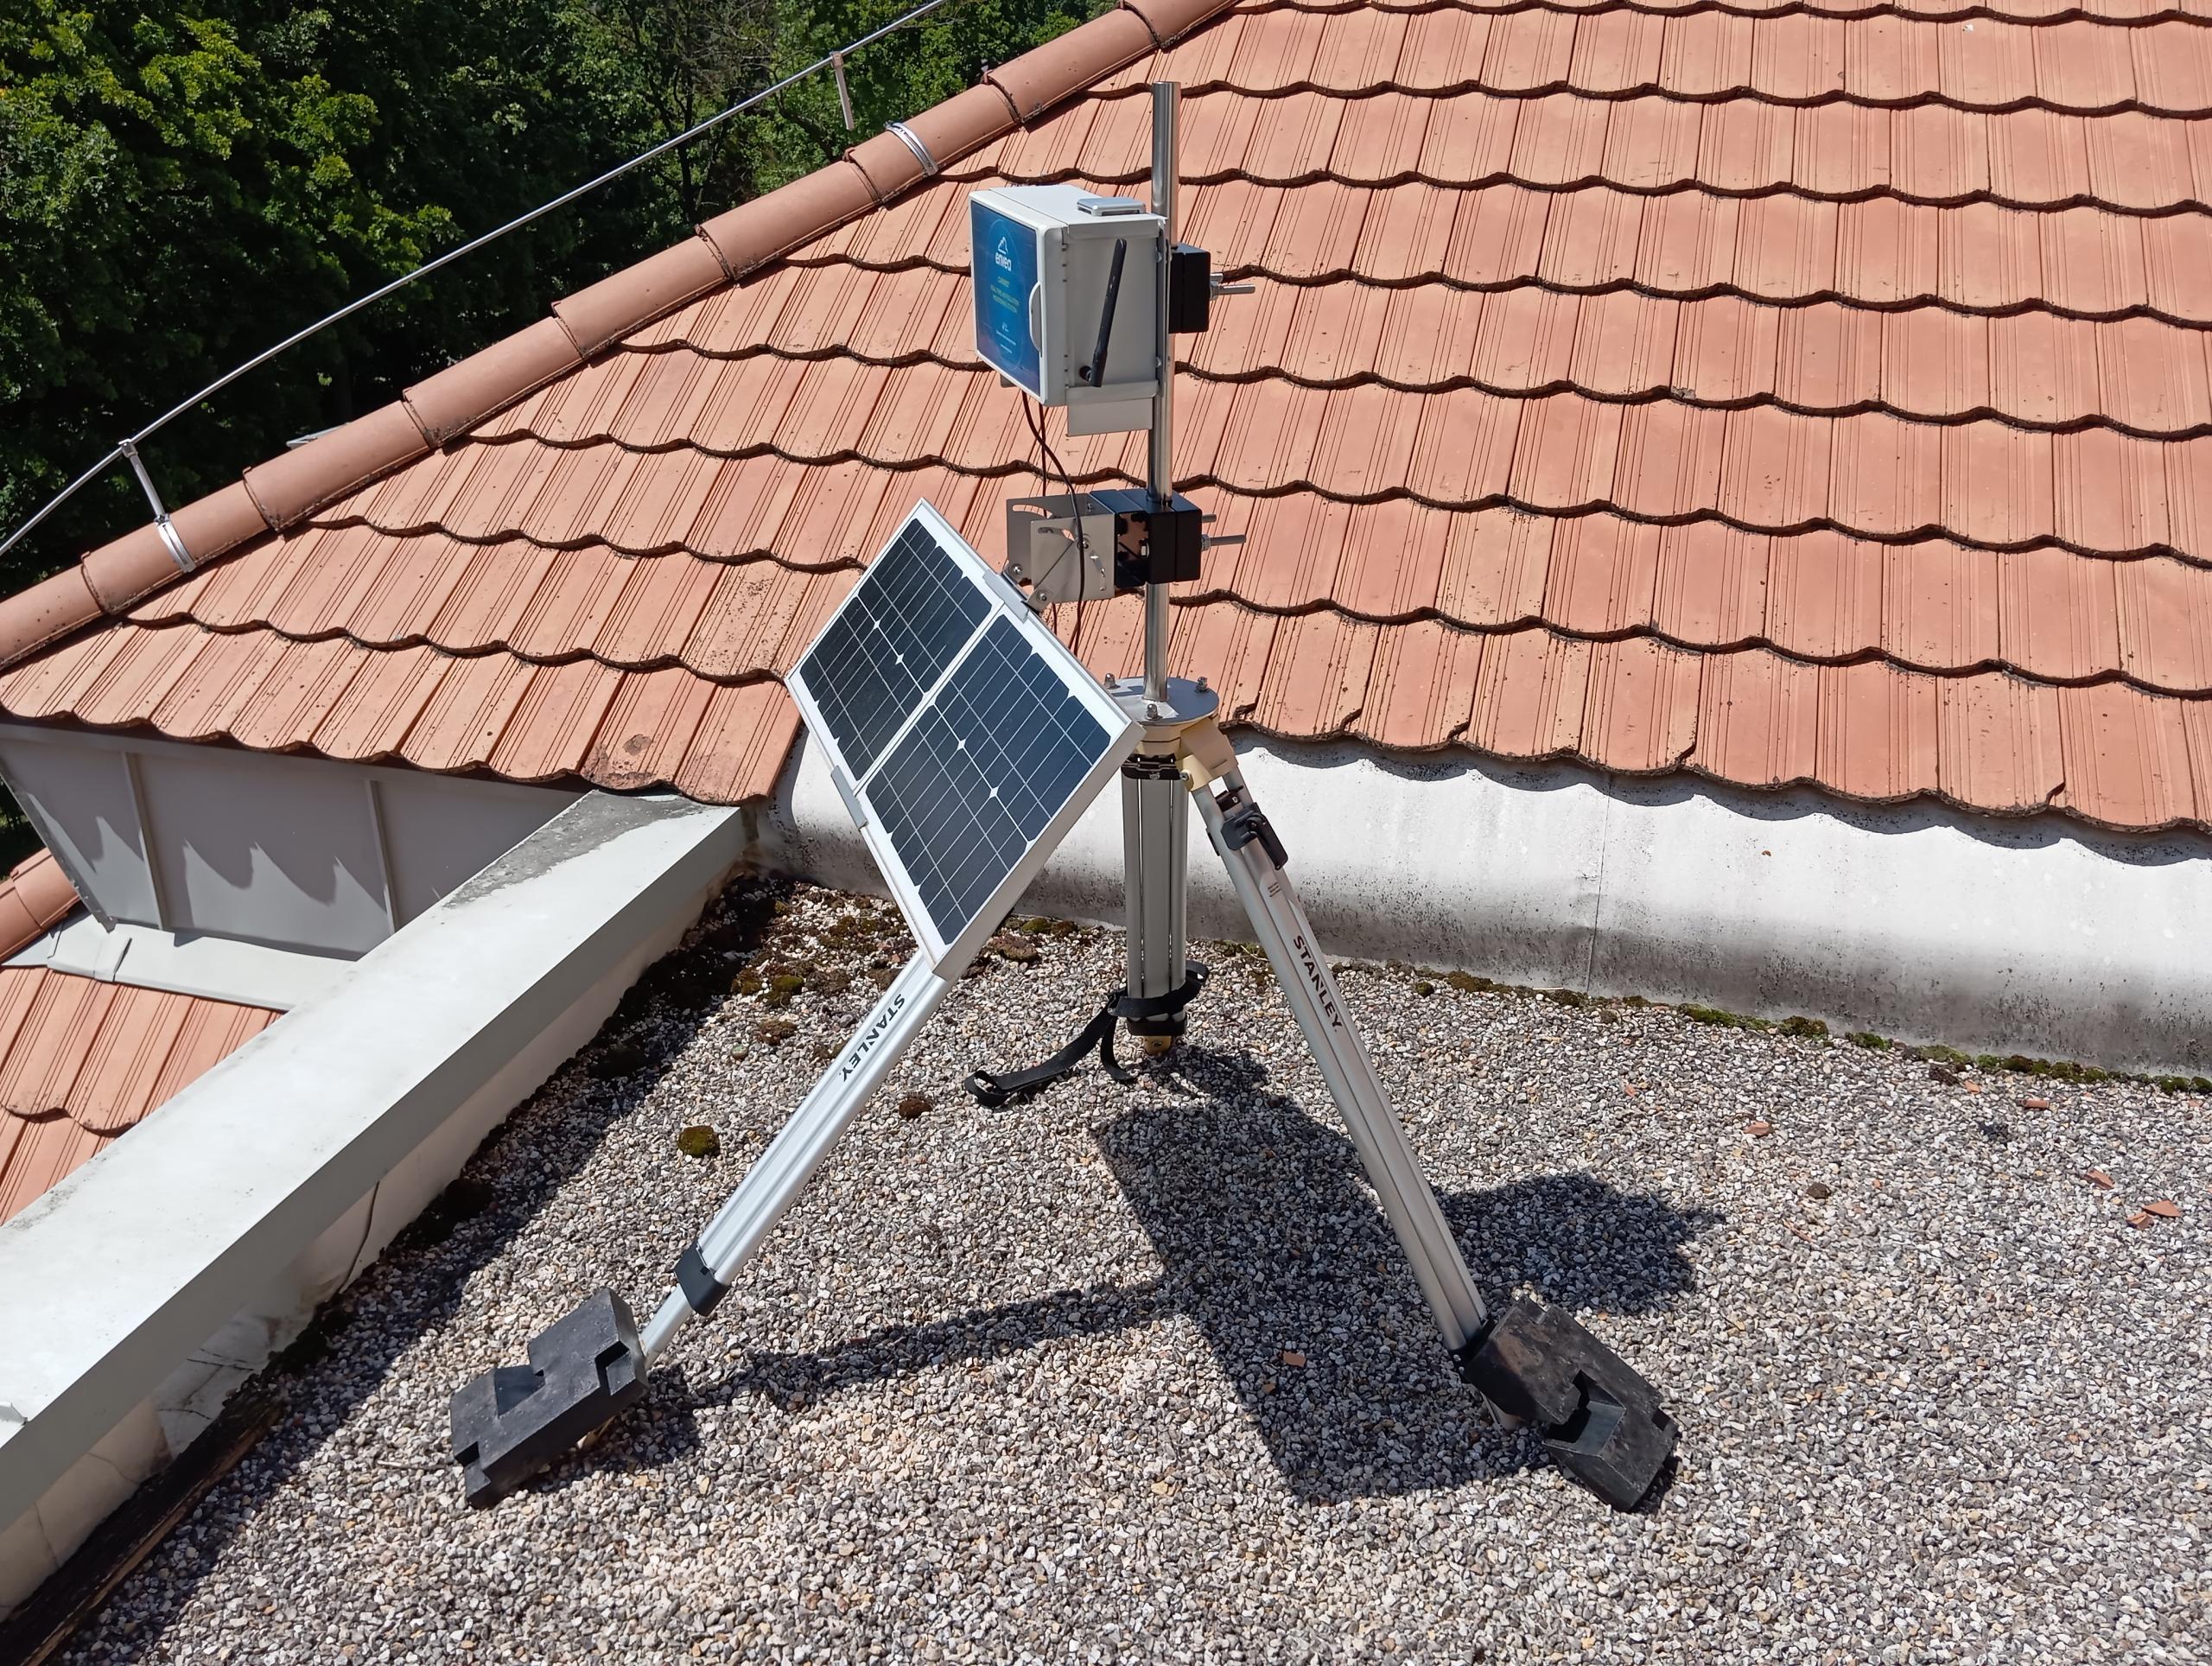
To gain a more accurate understanding of the air quality in different districts, the mobile sensors were relocated to new locations on May 28, 2025: the Kertvárosi Bányász Cultural Center, the Jászai Mari Theater, the Népház, and the flat-roofed section of the Municipal Hall. Starting from June 2025, residents of the Óváros, Újváros, and Kertváros residential neighborhoods will be able to monitor the air quality in their immediate surroundings on a daily basis.
The current measurement data can be accessed on the municipality’s homepage under the “Current Air Quality Data” section. The map shows the locations of the measurement stations. A single click on the map opens a combined chart that displays the current values of the station, color-coded, for the past five days. The interactive interface allows users to select individual pollutants, and information about the informational and alert threshold values, as well as other related data, is also available.